MORE ANALYSES
More than the single order.
Commerce metrics, products, goal steps, platform reconciliation and data quality complement the journey. Every view names its data basis.
See all areas in the demo ↗THE PRODUCT
Metrunio connects measured ad contacts, recorded steps in the shop, and orders or enquiries. Attribution stays a traceable model decision.
01 / ONE EXAMPLE. THREE PERSPECTIVES.
A channel report shows the distribution. A journey shows the path. A question leads straight to the right analysis.
CUSTOMER PATH · SAMPLE DATASET
Connect the measured ad contacts with the recorded steps in the shop. A visit without a purchase has a history too.
Recorded click on the campaign “Meta Prospecting: Backvideos”.
Reported shop events, no recording of the screen.
Only reported completions. Missing steps are not filled in.
Metrunio shows what could be recorded and linked. Not a complete observation of every person and no replay of their mouse movements.
02 / ASK YOUR DATA
Ask Metrunio about an order, a channel or a data gap. The answer shows the basis it used and takes you to the right analysis.
In the portal on every plan, with ten questions a month on the free one. With your own AI tool it also works outside the portal, through MCP, an interface that only reads: from Growth, by signing in through the portal or with your own read key.
EXAMPLE · PREPARED, NOT A LIVE QUERY
16 journeys added something to the cart this week and had not bought as of the data cut-off. The five most recent started via Paid social, Direct, Direct, Direct, Direct. A cart value is not revenue.
Week: 5 Oct 2026–11 Oct 2026 · Europe/Berlin
Sample data as of: 5 Oct 2026, 12:18
| Basis | In this example |
|---|---|
| Tool | journeys · abandonedCart: true |
| Period | 5 Oct 2026–11 Oct 2026 · Europe/Berlin |
| As of | 5 Oct 2026, 12:18 |
A later purchase changes the result. Why someone did not buy is not in the data. The assistant names causes only with evidence.
jr_93752d1e864f · Paid social · cart as the last measured step
Open journey →03 / TRACEABLE MEASUREMENT
Metrunio separates measured events from attribution by a model. That helps you understand discrepancies and check open questions in a targeted way.
With its own tag, Metrunio also measures delivery and viewability of ads, in ad environments that allow your own tag. Post-view, meaning ads that were seen but not clicked, is included from Pro.
Put attribution models side by side. Different shares are a different distribution, not proof of additional sales.
Unattributed orders or leads, missing costs and limited coverage become visible. An unknown number does not turn into zero.
MORE ANALYSES
Commerce metrics, products, goal steps, platform reconciliation and data quality complement the journey. Every view names its data basis.
See all areas in the demo ↗FOR LEADS TOO
For SaaS and lead businesses, Metrunio measures sign-up, setup and further goal steps, with the same attribution as for an order.
Guide to goal steps →04 / INCLUDED
Eighteen things the product does itself, in three tasks. What is not listed here, Metrunio does not measure; what it deliberately does not do is further down.
Click tracking
Signed tracking links. No open redirect, no foreign destination.
Impression tracking
Your own 1×1 pixel. You measure delivery yourself.
Viewability
A separate tag: 50 percent of the area, one second. Only visible counts.
Journeys
Linked deterministically, every visit step by step, purchase or not. No fingerprinting. The full visit history comes with Growth; below that, 7 or 30 days.
Web analytics
Page views, visits, time on site and bounce rate per channel, page and technology, with paths and real time. On every plan, counted for visitors with consent.
Funnel steps
Signed up, set up, first payment: one conversion per step, counted once per customer, with the channels per step. You set each step’s acquisition value yourself, kept apart from revenue.
Attribution
Seven models, each with and without post-view: two compared head to head, all seven in one table, one of them data-driven. Model comparison and post-view come with Pro and above.
Commerce
Contribution margin, when your shop sends margin and cart along. From Pro, also new-customer cost and margin ROAS per channel and campaign.
Budget
Campaigns sorted by what is known about them: measured (by experiment, from Scale), attributed, open.
Post-purchase question
“How did you hear about us?” on the thank-you page. The answers appear as self-reported next to what is measured, never in revenue and never in an attribution.
Website and conversion
App or plugin for Shopify, Shopware and WordPress, tag manager, snippet or server API. One data model, reports per website; several websites from Growth.
Data quality
Every finding names cause, effect and the next step.
Custom measurement domain
Measurement over your own address. Ad blockers then cut less often.
Export
CSV at raw-data level. Recalculate every figure yourself.
Report delivery
Weekly or monthly by email, with the breakdown as a CSV you can pass on.
Figures in words
Every key figure as a sentence too, with the way to the raw data behind it.
Progress
What has happened in your data, with no points, rank or streak.
Four interface languages
Website and portal in German, English, Spanish and French, per login and with number formats. Help and emails in German and English; Spanish and French readers get them in English.
05 / EVERY VIEW
Not a mock-up: these views are generated automatically from a live account, with generated but complete journeys and no customer data. Anything awkward stays in.
SAMPLE DATASET · GENERATED DATA
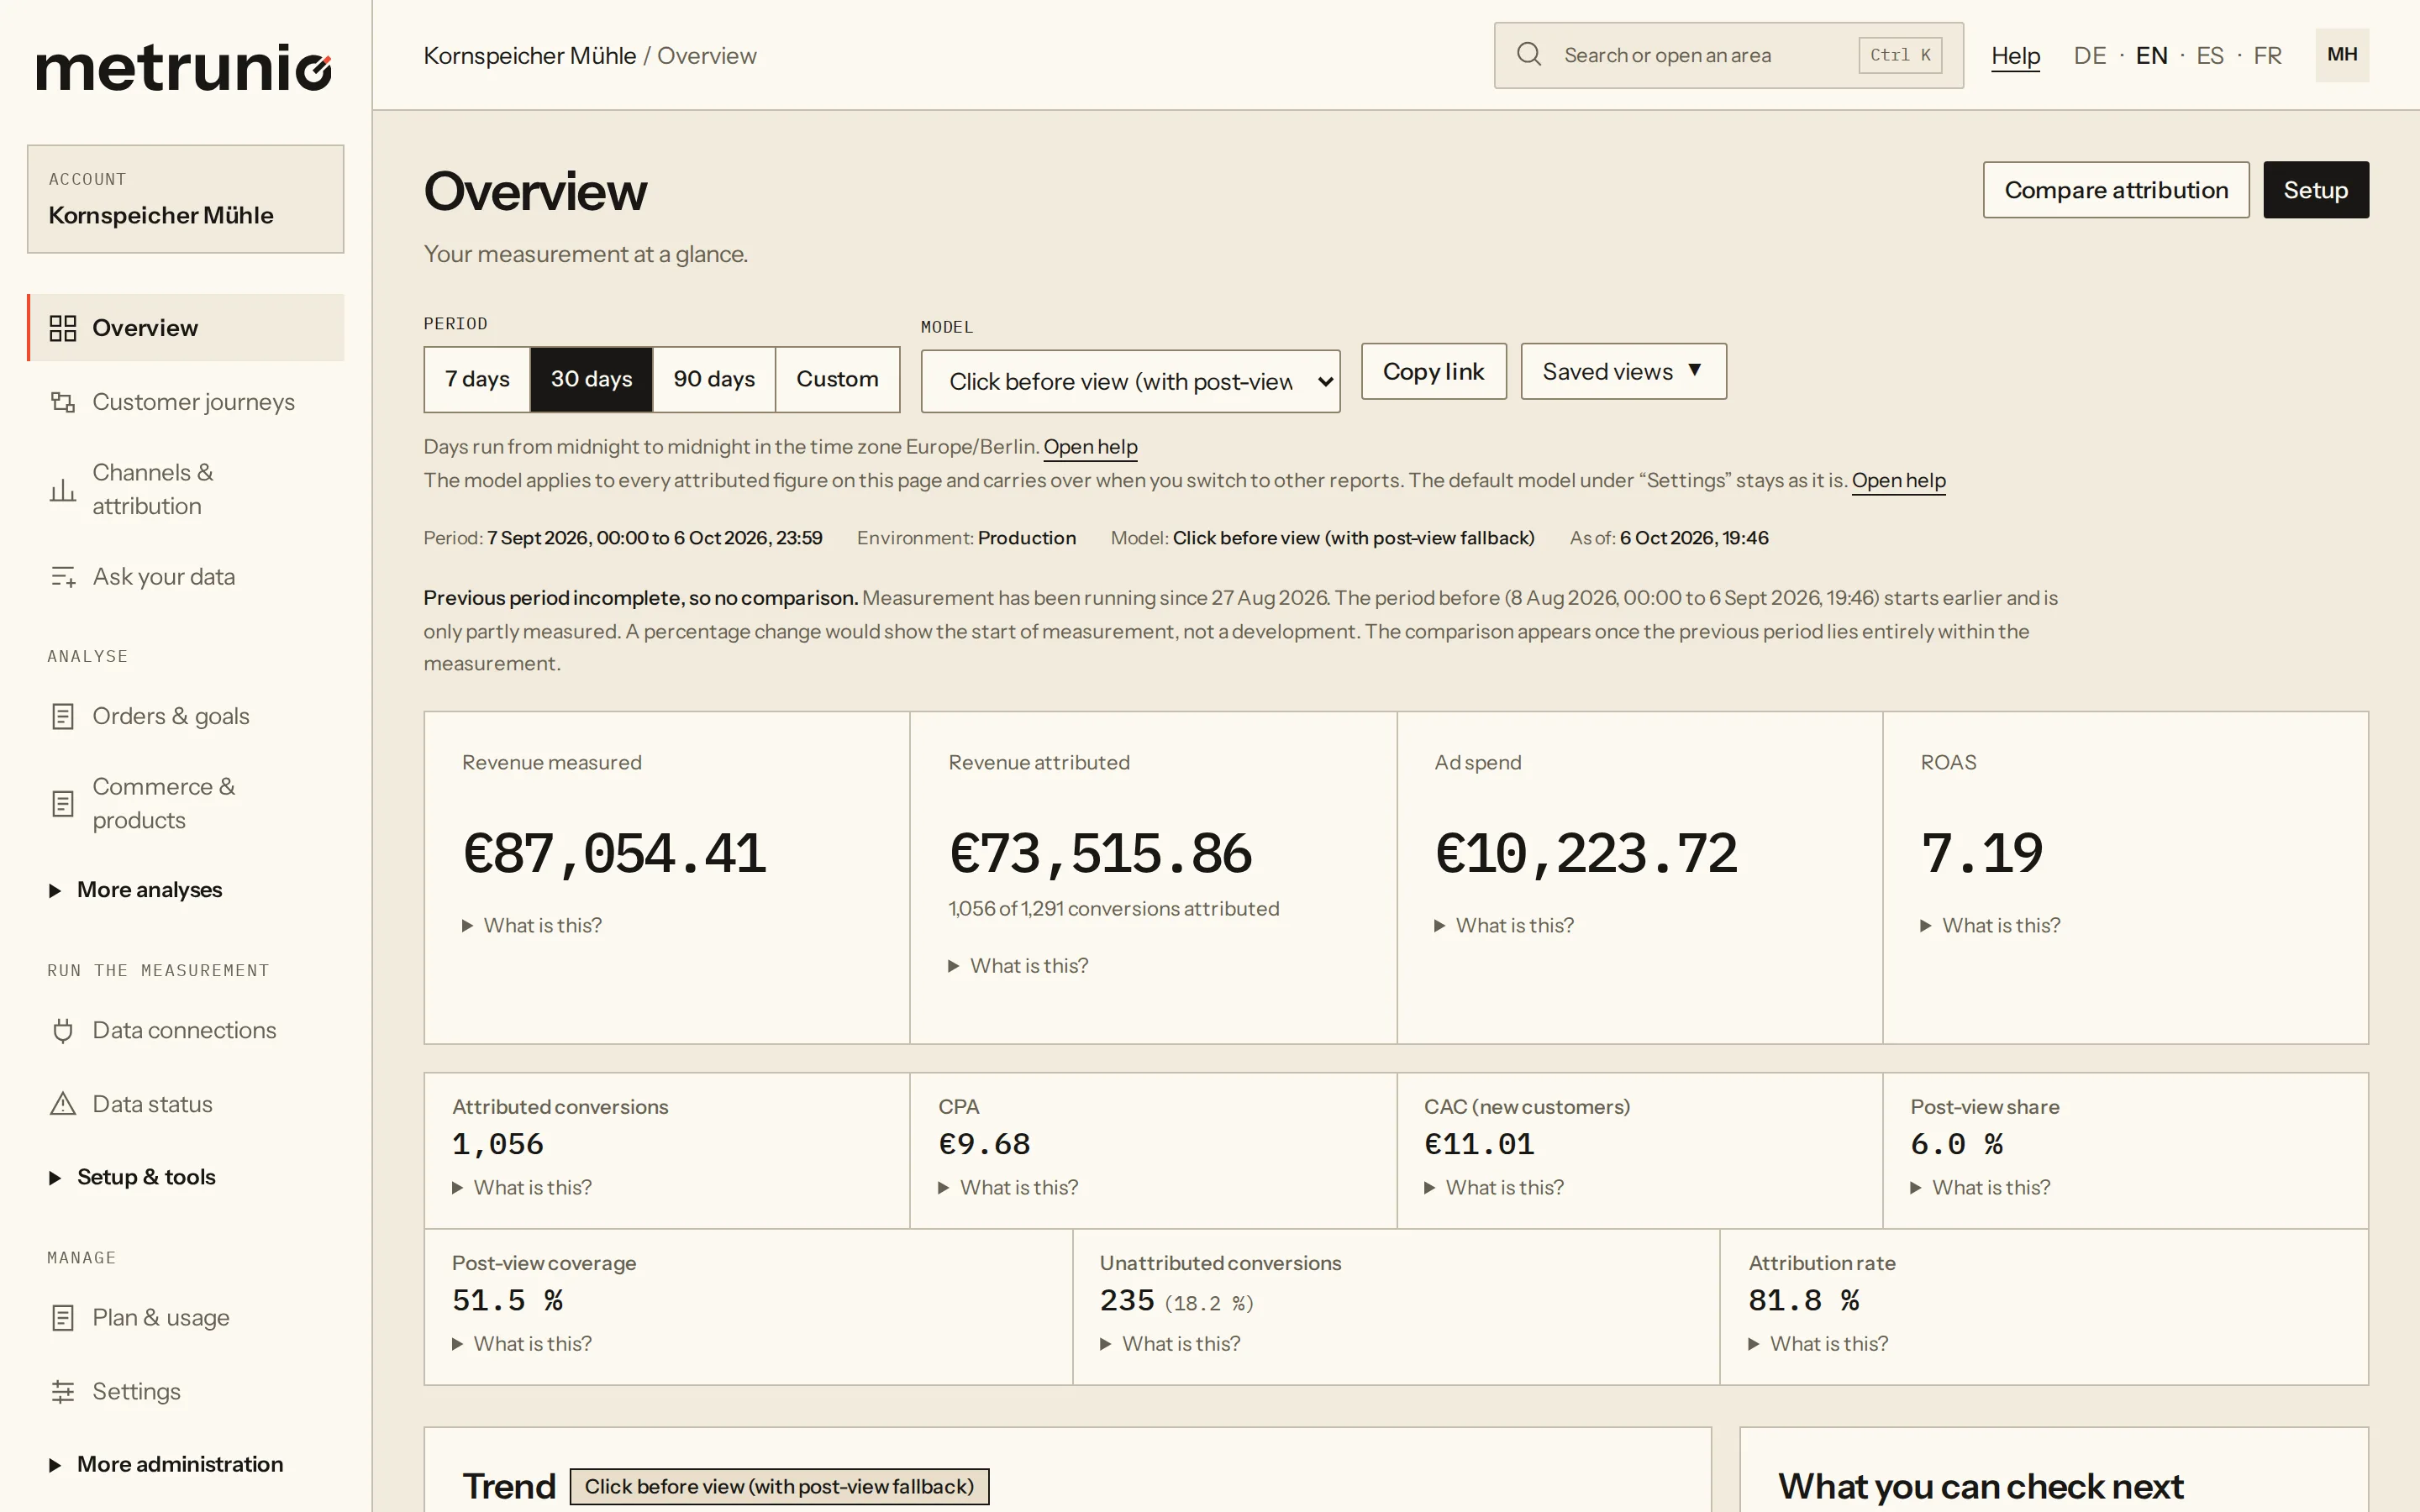
SAMPLE DATASET · GENERATED DATA
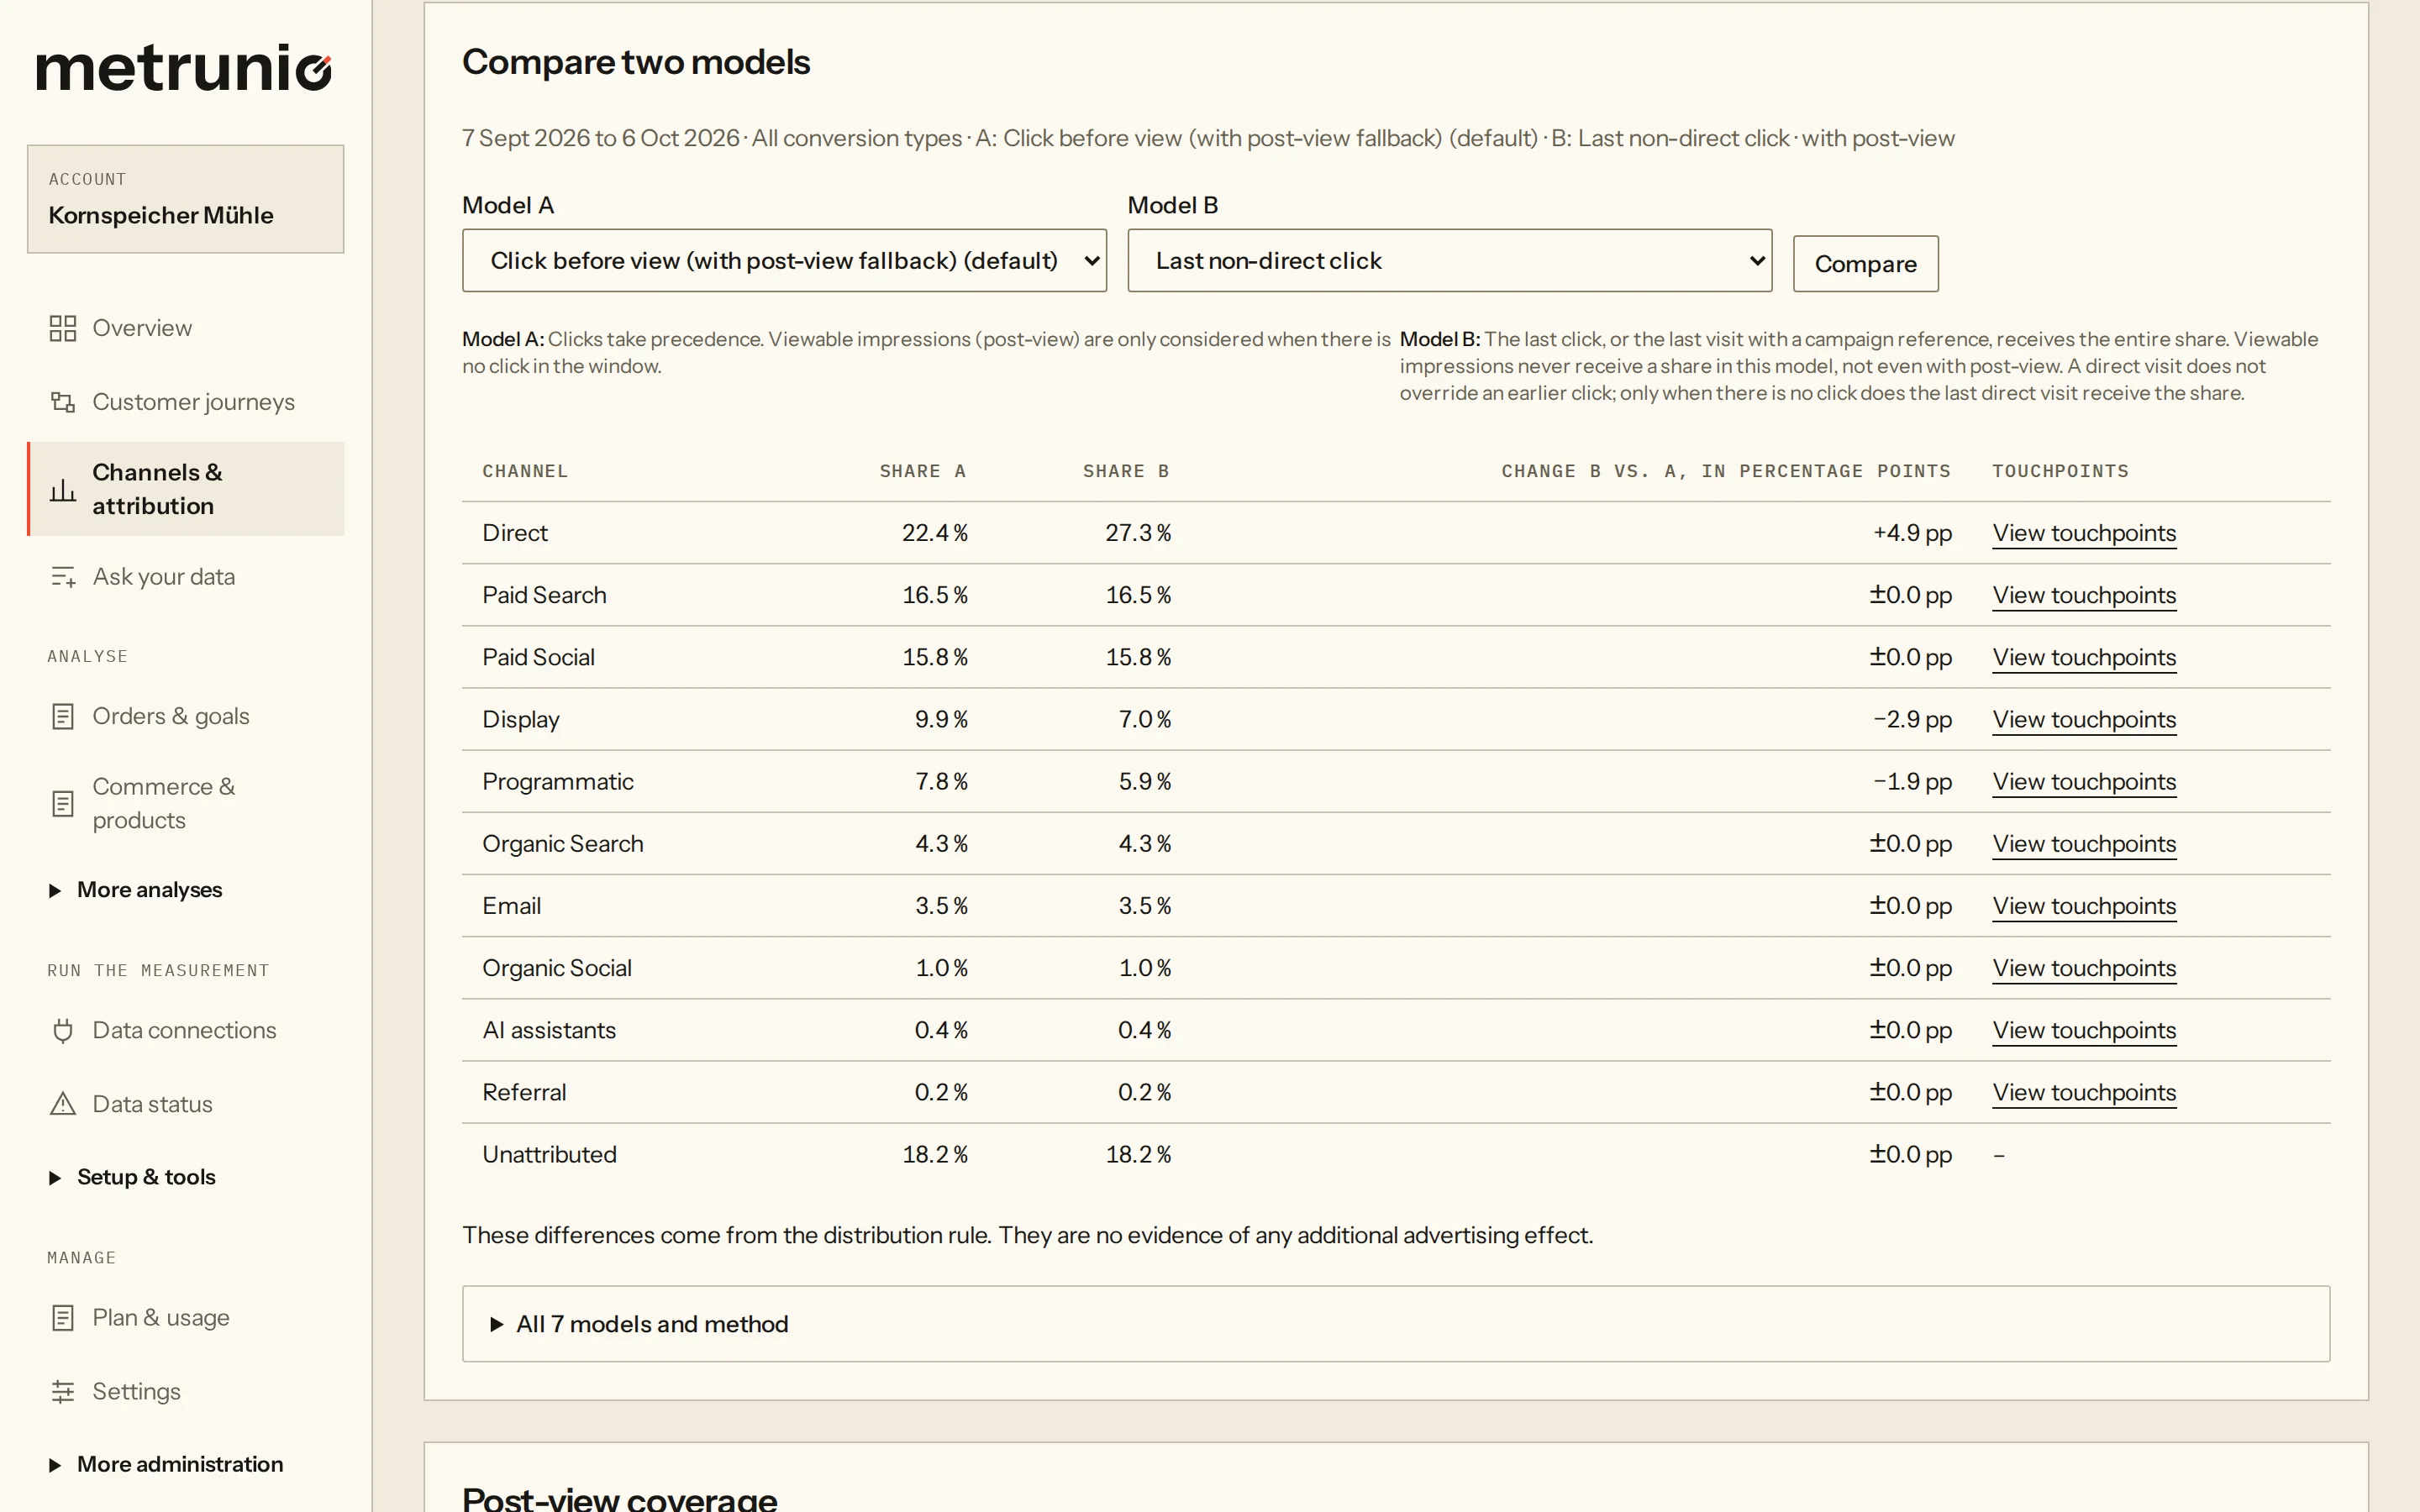
SAMPLE DATASET · GENERATED DATA
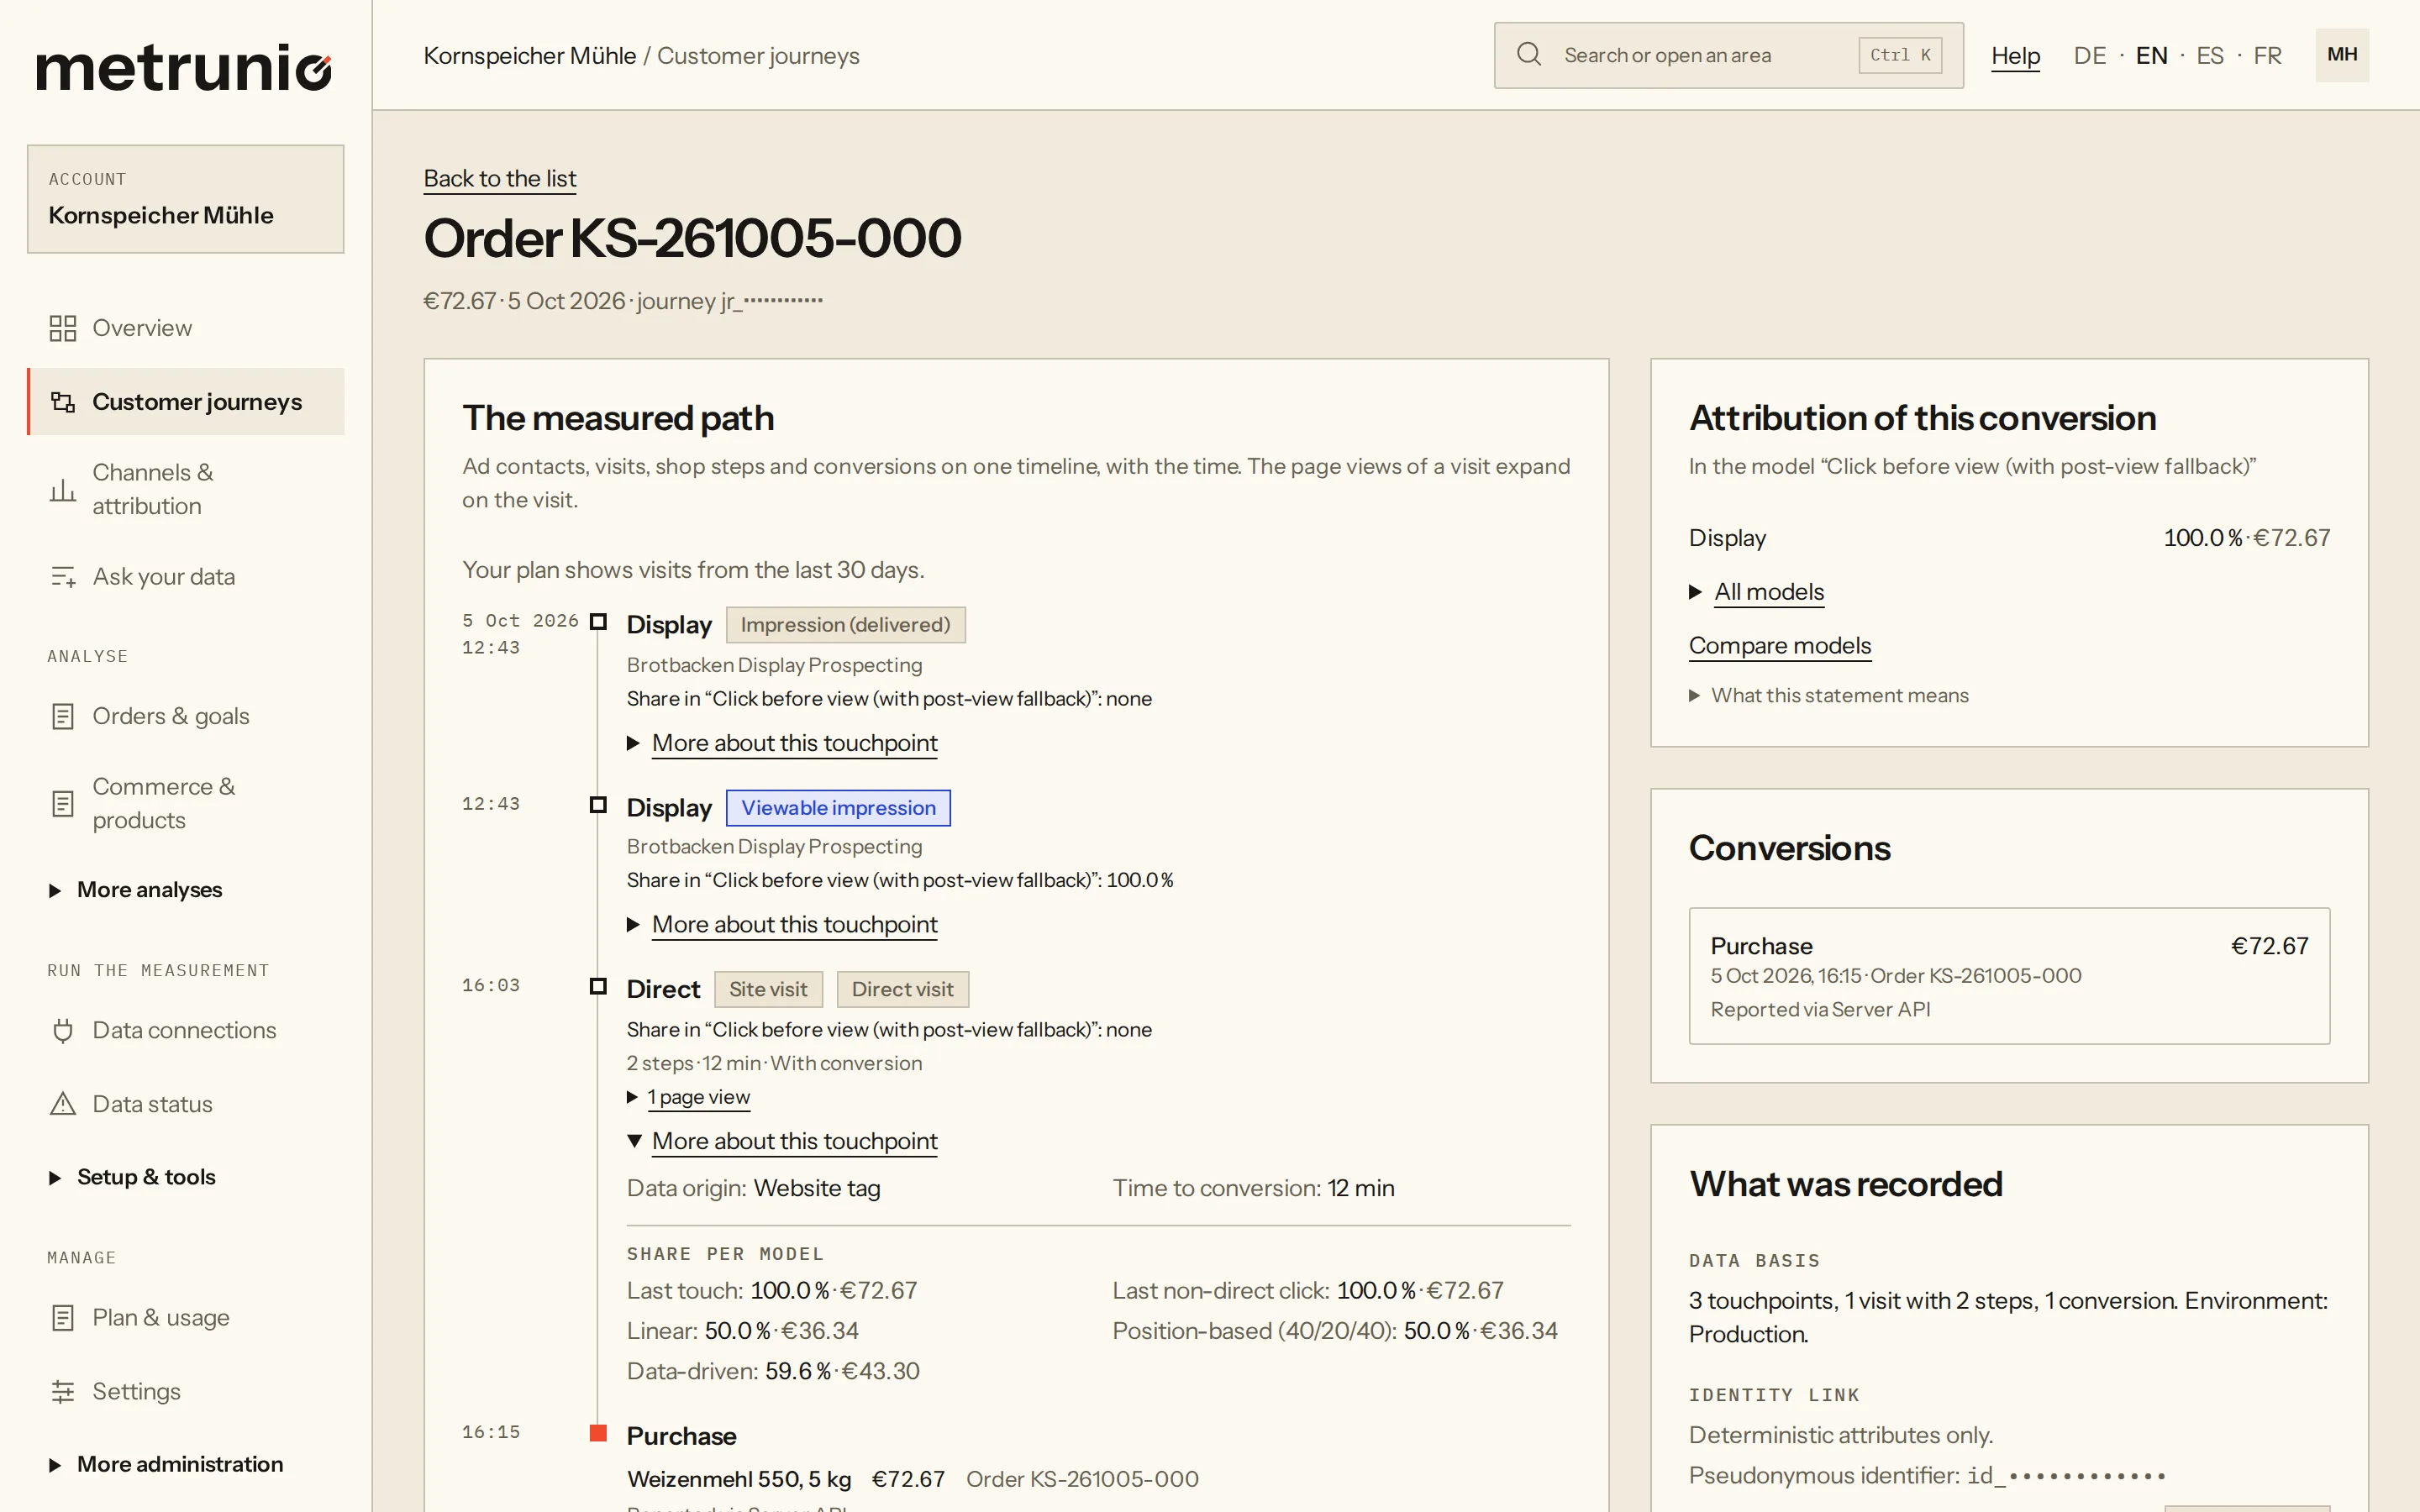
SAMPLE DATASET · GENERATED DATA
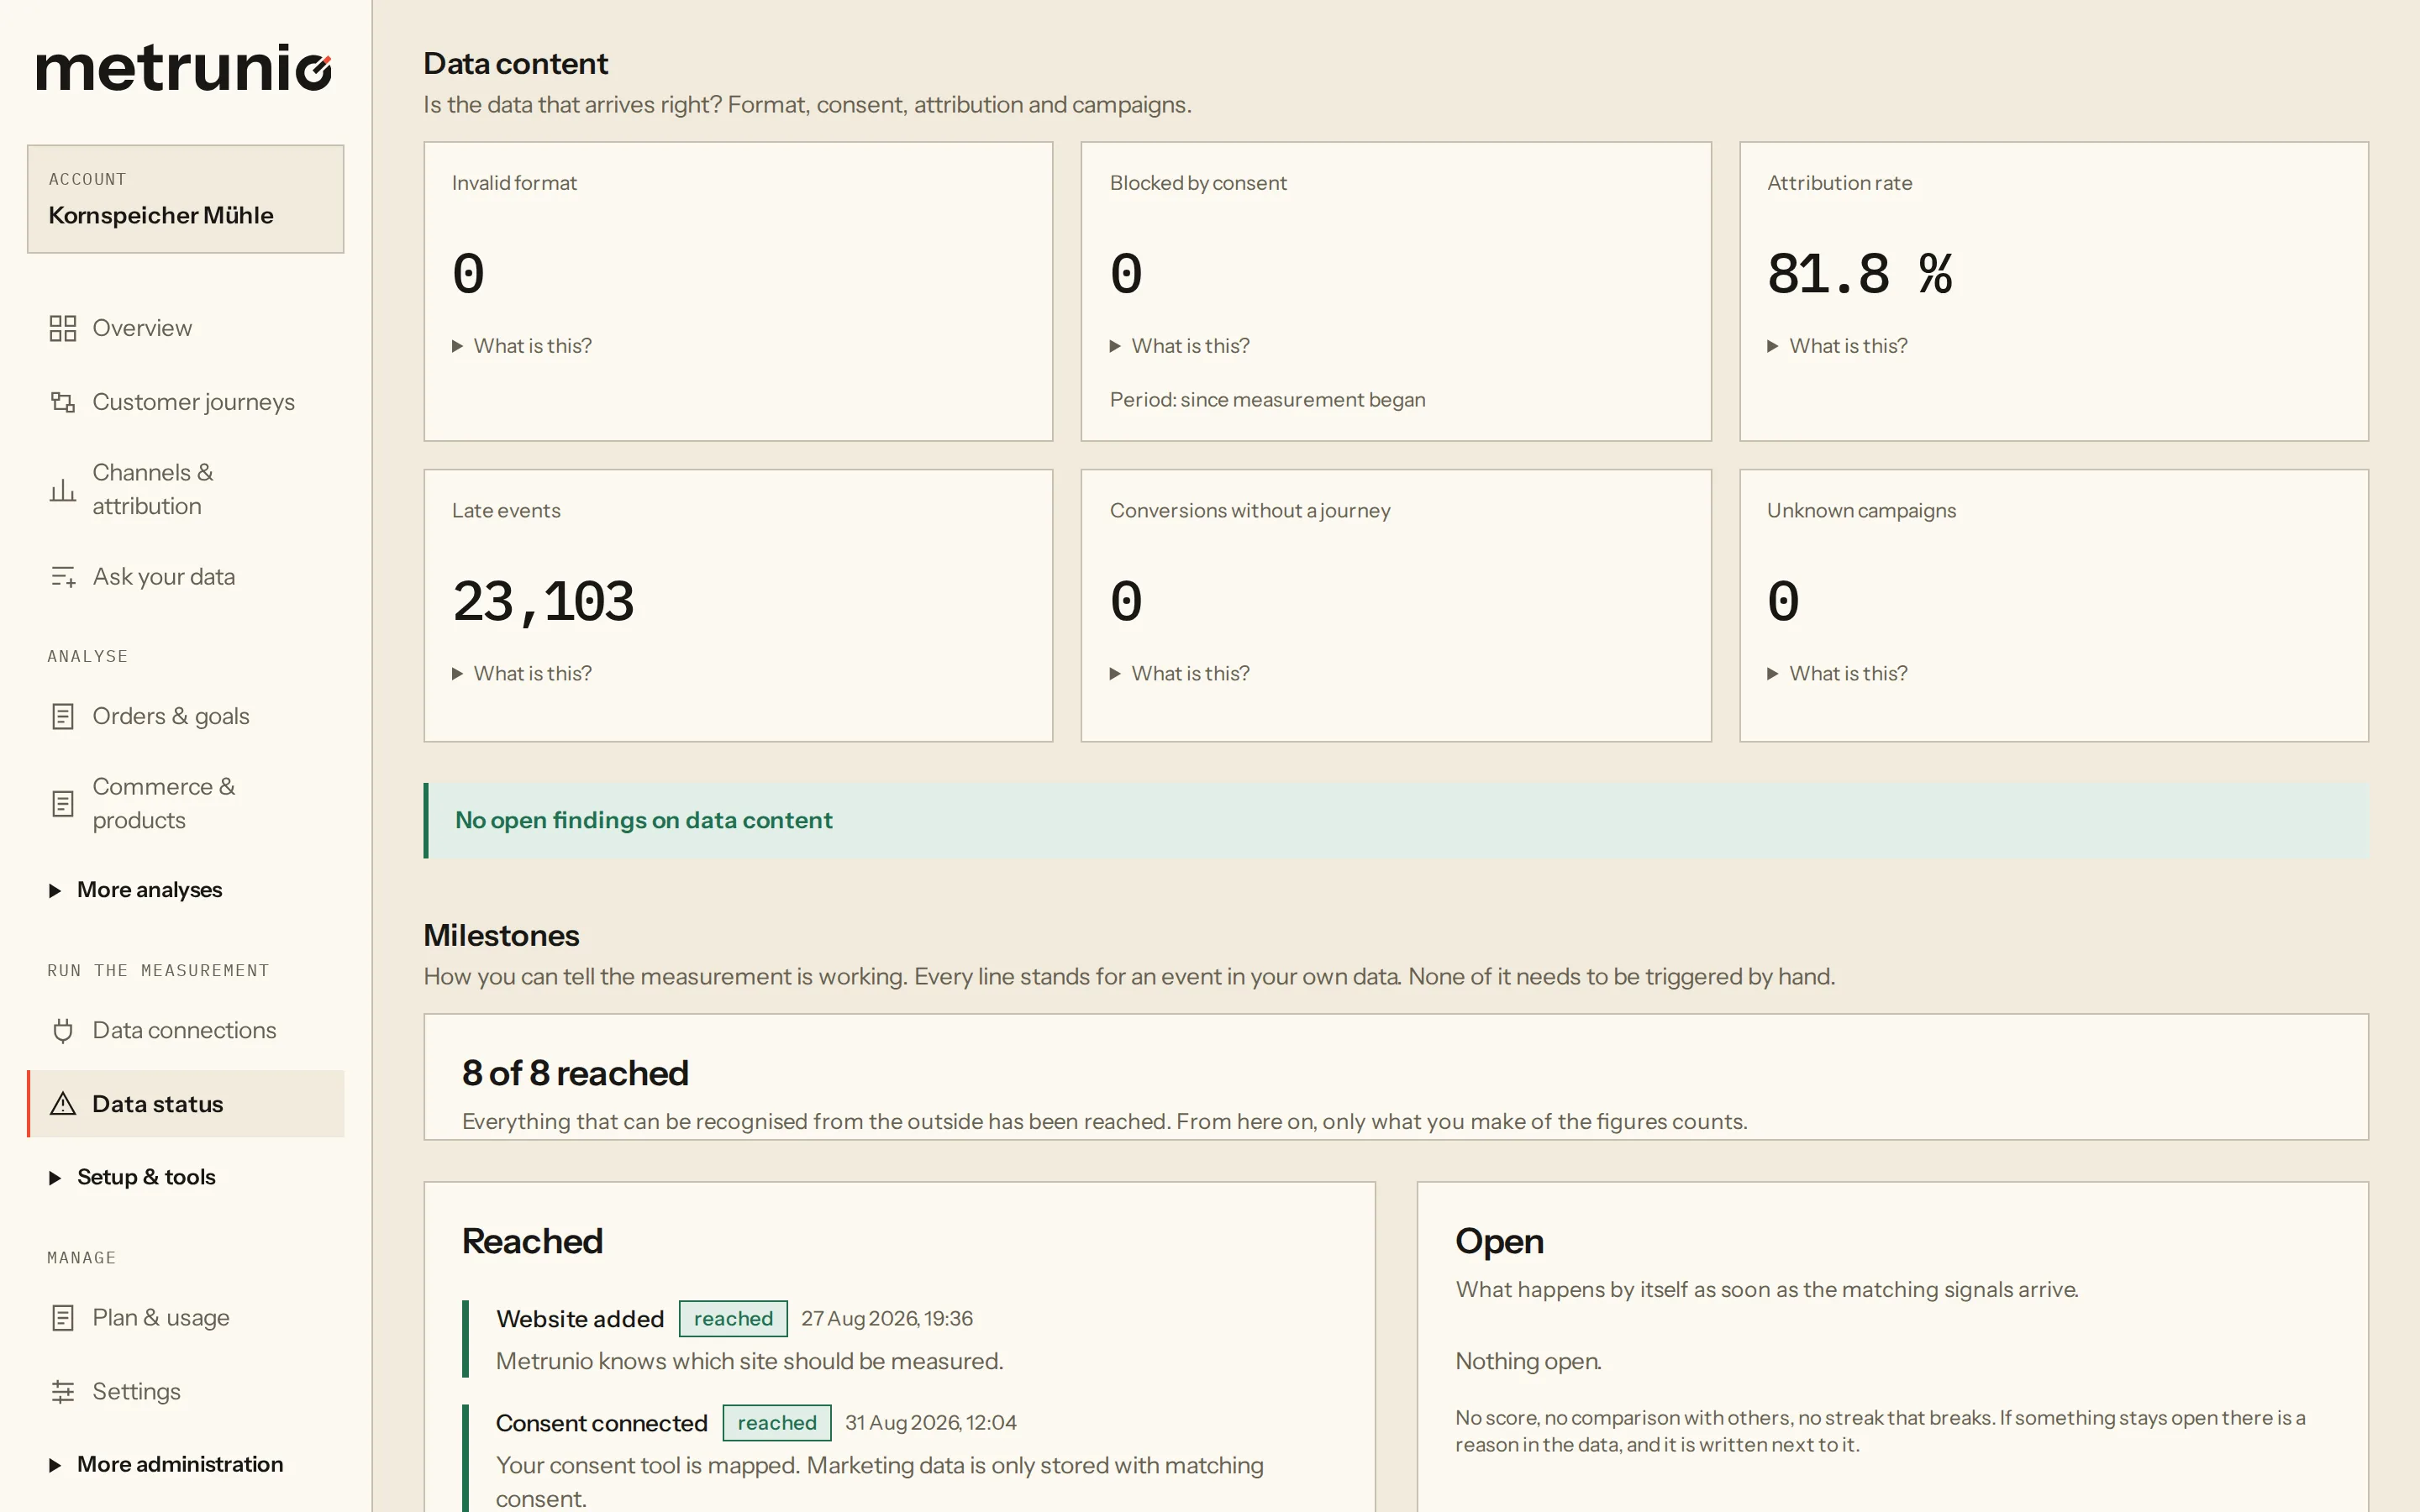
SAMPLE DATASET · GENERATED DATA
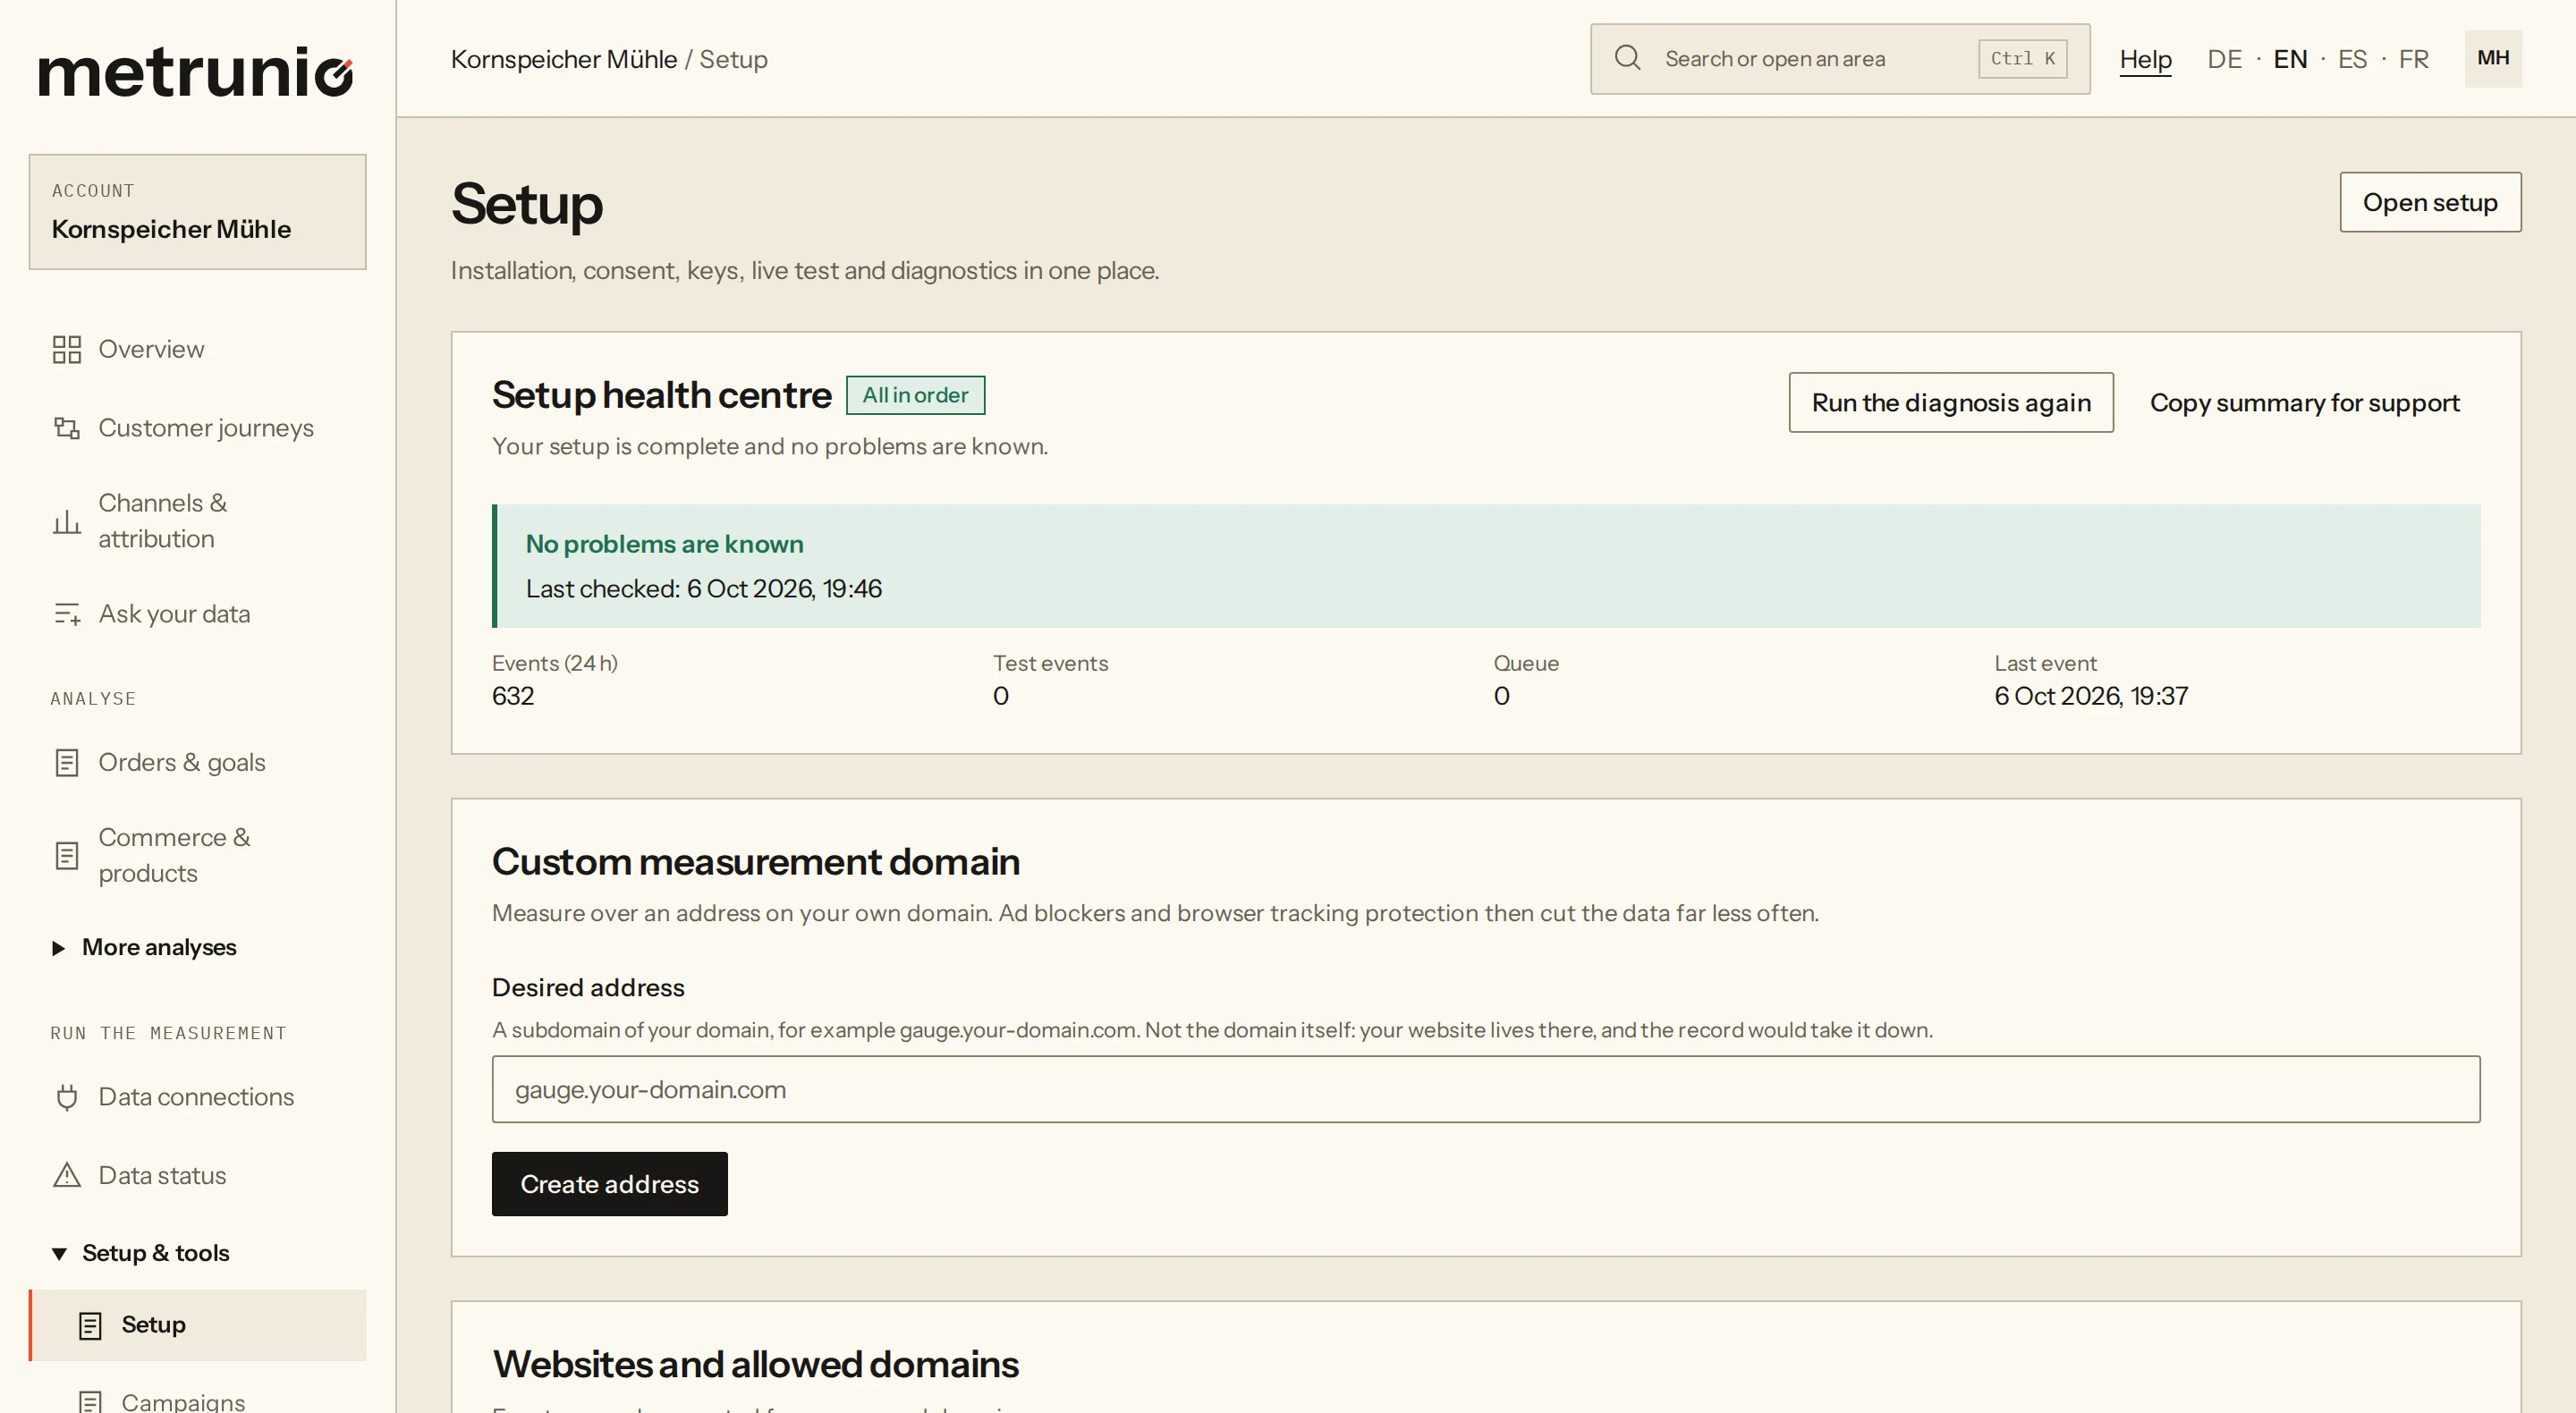
SAMPLE DATASET · GENERATED DATA
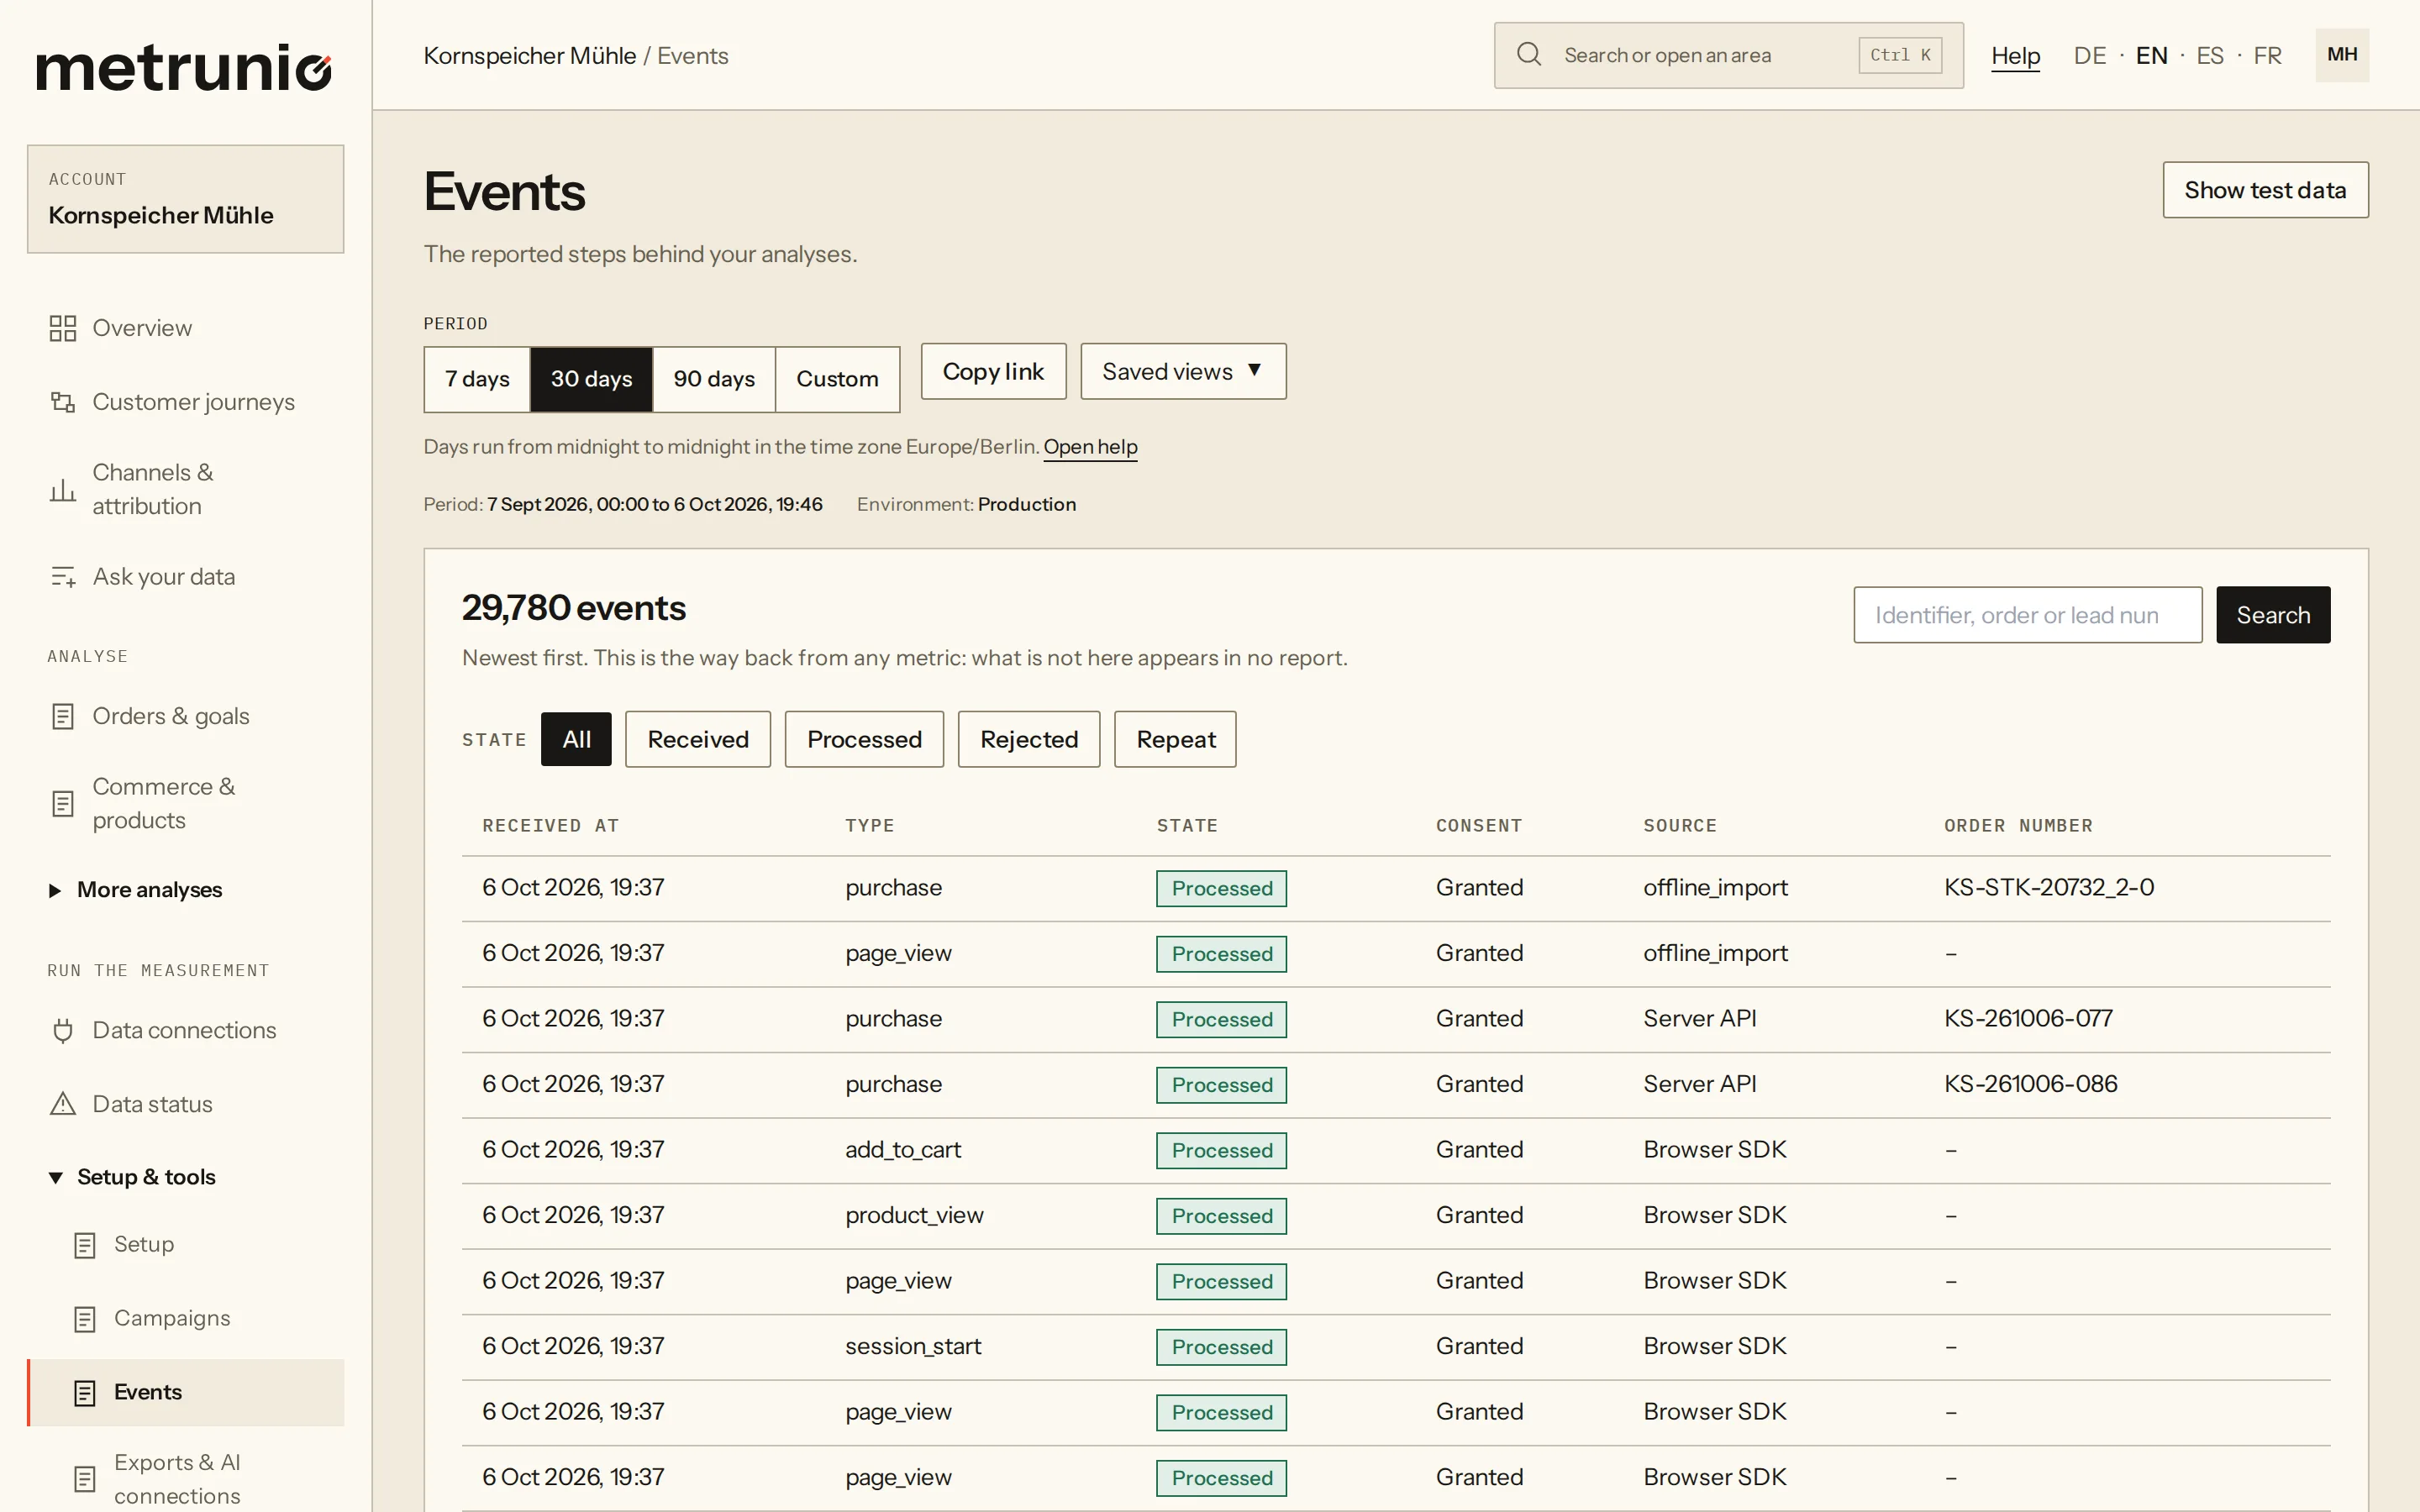
06 / DELIBERATELY OUTSIDE
Metrunio measures, connects and attributes. Probabilistic cross-device matching and fingerprinting, session recording (session replay), heatmaps, media mix modelling, automated budget allocation and ad serving are not part of it. Tools built for those exist, and the interfaces to them are open. What Metrunio deliberately does not do
PRINCIPLE
Where a signal is missing, we do not invent one. The conversion stays visibly “unattributed”.
Look around in the demo first. Your own account is currently available by invitation only.